VIDEO: Great Demo on Leadership and Tipping Points
[Via Global Guerrillas]
Make sure you turn on the audio for the commentary.
[More]
Here we can see the S-shaped curve of change adoption happen in real time.
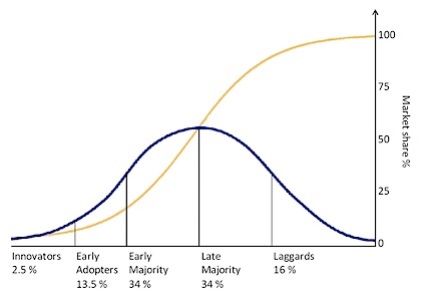
The X-axis is time and the yellow curve is the cumulative number of people adopting the change. The crowd dynamics almost exactly hit this curve. Assume a total crowd at the end of about 50 people.
We start with an innovator standing alone. Then another one joins and the two dance alone for almost 30 seconds. They are then followed by a third, for about 20 seconds.
The tipping point on the curve, the point of maximal adoption of change, occurs at 15-20%. So for a group of 50, we would expect to see a very rapid rate of adoption occurring when 7-10 people become involved.
And that is exactly what is seen. within 10 seconds after the 7th person has joined, the group more than triples in size, rapidly reaching its peak numbers.
It takes over a minute for the group to grow from 1 to 3. Within another 30 seconds, there are too many to count without freezing the video.
Exactly the same dynamics takes place when any sort of novel change hits a community; often not started by a half-naked dancer but by someone trying out something different.
And, just as the narrator explained about how important the second and third followers are, so to is it with other types of change. It is these early adopters who mediate change for the whole community, transforming a lone nut into a leader.
Without the second and third joiners, the whole movement would not have materialized. we often spend too much time on the leaders, the innovators, and not enough on those that create the tipping points – the mediators between the disruptive antics of the lone ‘nuts’ and the actions of the majority.
2 thoughts on “Watching a community adopt change”