Getting at data

Four Ways of Looking at Twitter
[Via HarvardBusiness.org]

Data visualization is cool. It’s also becoming ever more useful, as the vibrant online community of data visualizers (programmers, designers, artists, and statisticians — sometimes all in one person) grows and the tools to execute their visions improve.

Jeff Clark is part of this community. He, like many data visualization enthusiasts, fell into it after being inspired by pioneer Martin Wattenberg‘s landmark treemap that visualized the stock market.

Clark’s latest work shows much promise. He’s built four engines that visualize that giant pile of data known as Twitter. All four basically search words used in tweets, then look for relationships to other words or to other Tweeters. They function in almost real time.

“Twitter is an obvious data source for lots of text information,” says Clark. “It’s actually proven to be a great playground for testing out data visualization ideas.” Clark readily admits not all the visualizations are the product of his design genius. It’s his programming skills that allow him to build engines that drive the visualizations. “I spend a fair amount of time looking at what’s out there. I’ll take what someone did visually and use a different data source. Twitter Spectrum was based on things people search for on Google. Chris Harrison did interesting work that looks really great and I thought, I can do something like that that’s based on live data. So I brought it to Twitter.”

His tools are definitely early stages, but even now, it’s easy to imagine where they could be taken.

Take TwitterVenn. You enter three search terms and the app returns a venn diagram showing frequency of use of each term and frequency of overlap of the terms in a single tweet. As a bonus, it shows a small word map of the most common terms related to each search term; tweets per day for each term by itself and each combination of terms; and a recent tweet. I entered “apple, google, microsoft.” Here’s what a got:

twittervenn.jpg

Right away I see Apple tweets are dominating, not surprisingly. But notice the high frequency of unexpected words like “win” “free” and “capacitive” used with the term “apple.” That suggests marketing (spam?) of apple products via Twitter, i.e. “Win a free iPad…”.

I was shocked at the relative infrequency of “google” tweets. In fact there were on average more tweets that included both “microsoft” and “google” than ones that just mentioned “google.”

[More]

Social media sites provide a way to not only map human networks but also to get a good idea of what the conversations are about. Here we can see not only how many tweets are discussing apple, microsoft and goggle but the combinations of each.

Now, the really interesting question is how ti really get at the data, how to examine it in order to discover really amazing things. This post examines ways to visually present the data.

Visuals – those will be some of the key revolutionary approaches that allow us to take complex data and put it into terms we can understand. These are some nice begining points.

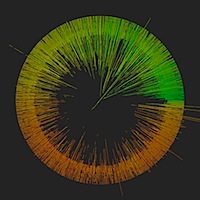
An interesting juxtaposition

data by blprnt_van

Reaching Agreement On The Public Domain For Science
[Via Common Knowledge]

Photo outside the Panton Arms pub in Cambridge, UK, licensed to the public under Creative Commons Attribution-ShareAlike by jwyg (Jonathan Gray).

Today marked the public announcement of a set of principles on how to treat data, from a legal context, in the sciences. Called the Panton Principles, they were negotiated over the summer between myself, Rufus Pollock, Cameron Neylon, and Peter Murray-Rust. If you’re too busy to read them directly, here’s the gist: publicly funded science data should be in the public domain, full stop.

[More]

and this

BBC News – Science damaged by climate row says NAS chief Cicerone
[Via BBC News | Science/Nature]

Leading scientists say that the recent controversies surrounding climate research have damaged the image of science as a whole.

President of the US National Academy of Sciences, Ralph Cicerone, said scandals including the “climategate” e-mail row had eroded public trust in scientists.

[snip]

He said that this crisis of public confidence should be a wake-up call for researchers, and that the world had now “entered an era in which people expected more transparency”.

“People expect us to do things more in the public light and we just have to get used to that,” he said. “Just as science itself improves and self-corrects, I think our processes have to improve and self-correct.”

[More]

It is important for Federally funded research to be in the public domain. But, Universities, who hope to license the results of this research, and corporations, who will not as likely commercialize a product if they can not lock up the IP, Both of these considerations must be accounted for if we want to translate basic research into therapies or products for people.

So, as the Principles seem to indicate, most of this open data should happen AFTER publication, so this would give the proper organizations to make sure they have any IP issues dealt with.

But what about unpublished data? What about old lab notebooks? The problem supposedly seen now has nothing to do with data that was published. It has to do with emails between scientists. Is this relevant data that should be made public for any government funded research?

Who determines which data are relevant or not?

And what about a researcher’s time? More time in front of the public, more time filling out FOIs, more time not doing research in the first place.

The scientific world is headed this way but how will researcher’s adjust? There will have to be much better training of effectively communicating science to a much wider audience than most scientists are now comfortable with.


Filters lead us to wisdom

filters by aslakr
[2b2k] Clay Shirky, info overload, and when filters increase the size of what’s filtered
[Via Joho the Blog]

Clay Shirky’s masterful talk at the Web 2.0 Expo in NYC last September — “It’s not information overload. It’s filter failure” — makes crucial points and makes them beautifully. [Clay explains in greater detail in this two part CJR interview: 1 2]

So I’ve been writing about information overload in the context of our traditional strategy for knowing. Clay traces information overload to the 15th century, but others have taken it back earlier than that, and there’s even a quotation from Seneca (4 BCE) that can be pressed into service: “What is the point of having countless books and libraries whose titles the owner could scarcely read through in his whole lifetime? That mass of books burdens the student without instructing…” I’m sure Clay would agree that if we take “information overload” as meaning the sense that there’s too much for any one individual to know, we can push the date back even further.

[More

David Weinberger has been one of my touchstones ever since I read The Cluetrain Manifesto. I cried when I read that book because it so simply rendered what I had achingly been trying to conceptualize.

Dealing with information glut today leverages an old way of doing things in a new way. It uses synthesis rather than analysis. Analysis gave us the industrial revolution. Breaking the complex down into small understandable bits allowed us to create the assembly line that could put together our greatest creations, such as the Space Shuttle, with more than 2.5 million parts.

Yet a single O-ring can destroy the whole thing.

Synthesis brings together facts, allows us to see them in new ways. But to attack the really complex problems of today, we need to utilize synthesis from a wide range of viewpoints, all providing their own filter. As with the story of the 5 blind men and the elephant, no one person has all the information. But a synthesis of everyone’s information provides a reasonable approximation.

David discusses this view:

A traditional filter in its strongest sense removes materials: It filters out the penny dreadful novels so that they don’t make it onto the shelves of your local library, or it filters out the crazy letters written in crayon so they don’t make it into your local newspaper. Filtering now does not remove materials. Everything is still a few clicks away. The new filtering reduces the number of clicks for some pages, while leaving everything else the same number of clicks away. Granted, that is an overly-optimistic way of putting it: Being the millionth result listed by a Google search makes it many millions of times harder to find that page than the ones that make it onto Google’s front page. Nevertheless, it’s still much much easier to access that millionth-listed page than it is to access a book that didn’t make it through the publishing system’s editorial filters.

It is through synthesis that new technologies allow us to deal with information glut. And this synthesis necessarily involves human social networks. Because humans are exquisitely positioned to filter out noise and find the signal.

I’ve discussed the DIKW model. Data simply exists. Information happens when humans interact with the data. Transformation of information, both tacit and explicit, produces knowledge, which is the ability to make a decision, to take an action. Often that action is to start the cycle again, generating more data and so on.

This can be quite analytical in approach as we try to understand something. But the final link in the cycle, wisdom, is the ability to make the RIGHT decision. This necessarily require synthesis.

New technologies allow us to deal with much more data than before, generate more information and produce more knowledge. However, without synthetic approaches that bring together a wide range of human knowledge, we will not gain the wisdom we need.

Luckily, the same technologies that produce so much data also provide us with the tools to leverage our interaction with knowledge. If we create useful social structures, ones that properly synthesize the knowledge, that employ human social networks that act as great filters, then we can more rapidly compete the DIKW cycle and take the correct actions.