Commentary: Summarizing papers as word clouds:
[Via Buried Treasure]
Lars discusses some interesting numbers and comes up with an intriguing solution.
For use in presentations on literature mining, I did a back-of-the-envelope calculation of how much time I would be able to spend on each new biomedical paper that is published. Assuming that all papers were indexed in PubMed (which they are not) and that I could read papers 24 hours per day all year around (which I cannot), the result is that I could allocate approximately 50 seconds per paper. This nicely illustrates the point that no one can keep up with the complete biomedical literature.
When I discovered Wordle, which can turn any text into a beautiful word cloud, I thus wondered if this visualization method would be useful for summarizing a complete paper as a single figure. To test this, I extracted the complete text of three papers that I coauthored in the NAR database issue 2008. Submitting these to Wordle resulted in the three figures below (click for larger versions):

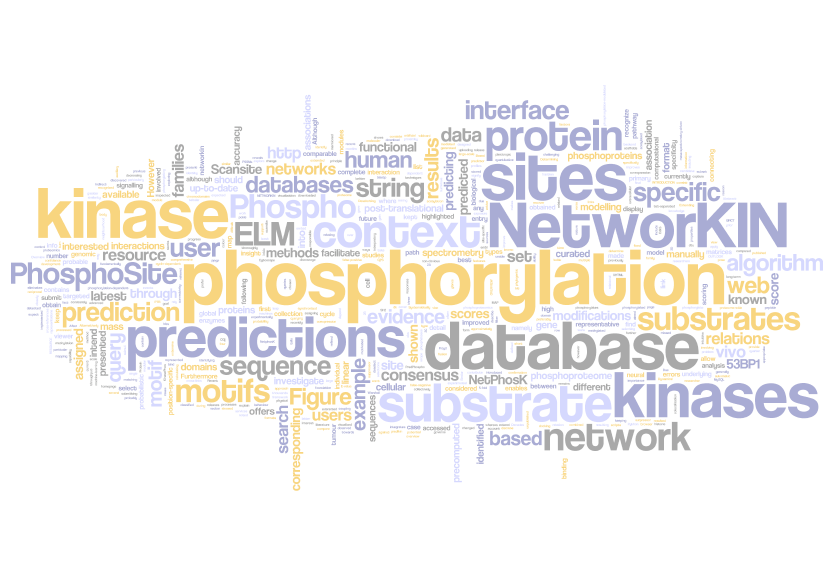

However, he does notice that this approach may not work for all articles, unless there are changes made, either in how the articles are written or in the software that creates the visuals.
…I think a large part of the problem is the splitting of multiwords; for example, “cell cycle” becomes two separate terms “cell” and “cycle”. Another problem is that words from different sections of the paper are mixed, which blurs the messages. These two issues could be solved by 1) detecting multiwords and considering them as single tokens, and 2) sorting the terms according to where in the paper they are mainly used.
Technorati Tags: Social media, Web 2.0